By Max Kaplan
League-wide, the conversion rate on 4th down is 50% but it jumps to 65% on 4th and 1. Ever wonder how likely it is to convert in a given situation? I ventured to find out, armed with the entire season’s worth of data from 2012.
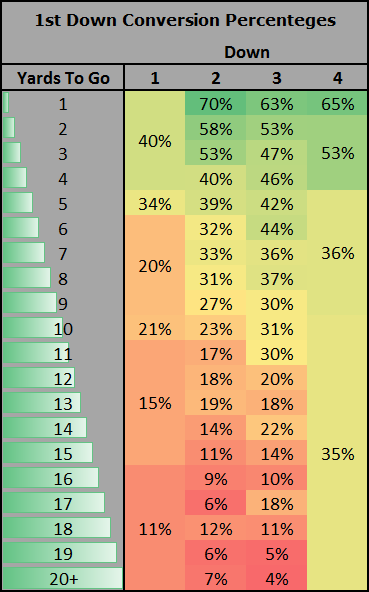
The goal of 1st down is to create a manageable 2nd down. The goal of 2nd down is to create a manageable 3rd down. But you have to convert, eventually. What are the percentages of converting on a given down and distance?
*2012 Season
Note: Bigger rectangles are ranges of situations - used when
there weren’t enough plays in a given down and distance.
Takeaways:
Get 5 yards or more on 1st down
Some teams measure success on first down by a 4+ yard rush. As you can see, there is some credence to that goal. Second-down conversion rates drastically increase as the yards-to-go decreases, more so than on any other down. In fact, a team should aim for 5+ yards on 1st down because of the huge drop from 2nd and 5 (39%) to 2nd and 6 (32%). If highly-paid offensive coordinators like Bill Callahan are open to advice from $10 per hour summer interns, perhaps high-percentage, short passes are the way to go on 1st down?
3rd and 6 or bust
The odds of converting on 3rd down plummet beyond 3rd and 6, dropping from 44% to 36% as a team progresses to 3rd and 7. It is a bit surprising to find such a stark contrast with only a small 1 yard difference.
High conversion rate on 4th down
Teams convert on 4th and 10+ (35%) much better than 3rd and 10+ (22%). Why is that? Well, I have no idea – if I did, then I’d probably be calling the plays in Dallas.
It seems that teams - when facing a possible turnover on downs – take more risks and throw both more picks and 1st downs.
Only 2 teams went through a game without a 2nd and 10
This is more of a fun fact, but only Cincinnati in Week 3 and Cleveland in Week 12 never encountered a 2nd and 10. There were no incompletions on first down for either team: only completions, rushes, turnovers, and sacks. The Bengals unloaded for 206 passing yards on 1st down in their win against the playoff-bound Redskins, and Cleveland accomplished the feat while defeating the #1 ranked defense in Pittsburgh.
So what did you think of my fourth and short column. Did I convert? It doesn’t really matter. Jason Garrett and an intern happen to have something in common – we just won’t get fired for mediocre performance.
I’m in the preseason of my career… and, well, we all know how important the preseason is.

Do you think you can find the percentage of 4th and 10+ plays that end in an interception? Just to see if it’s much higher than the average on other downs. Interesting article!
On 4th down and 10+, there were 92 plays, 32 first downs, 4 INT, and 9 sacks. The INT ratio isn’t that high, but that INT/Sack combined is very high compared to other downs.
The high conversion rate on 4th down may be due to the rarity of the situation, simply having a small sample size (the giant rectangle spanning from 4th and 10 to 20+ is indicative of this). Teams are only going attempt a 4th and long if they’re at the desperate end of a game - even then, they are probably only going to attempt it if they have a trick up their sleeve.
I’m wondering how field goals are being quantified here? Upon first read I assumed that field goals are counted as a failure to convert, but I’m not so sure now (seeing as how a field goal isn’t necessarily a “failure”).
Field goals are not a 4th down attempt - They are left out.
I pooled the situations so there would be a enough data points to be significant. Here are the 4th down numbers poorly formatted:
Plays Yds 1st%
1 158 3.56 64.60%
2 52 4.98 59.60%
3 34 3.82 50.00%
4 30 5.53 46.70%
5 32 3.19 34.40%
6 18 5.72 38.90%
7 14 7.29 42.90%
8 12 2 16.70%
9 9 9.89 55.60%
10 92 7.21 34.80%